
 This guest post was written by Shmuel Bornstein, a Business Development and Finance Associate at OurCrowd. Shmuel focuses on the secondary financing of OurCrowd’s portfolio companies.
——-
With access to increasing investment opportunities spanning global markets and asset classes, it is no wonder that many investors feel overwhelmed by their choices. One of the challenges of navigating the decision waters of where to invest is the seeming inability to compare between different opportunities; what does the risk-reward profile of an Australian REIT have to do with a 10-year US government backed bond?
To overcome this, the financial world has engineered tools that allow comparing oranges and apples—the IRR being a staple.
What is the Internal Rate of Return (IRR)?
Here’s the technical definition. Bear with me. The internal rate of return on an investment is the annualized effective compounded return rate that makes the net present value of all cash flows (both positive and negative) from a particular investment equal to zero. It can also be defined as the discount rate at which the present value of all future cash flows are equal to the initial investment or, in other words, the rate at which an investment breaks even.
Simply put, the IRR of an investment is the discount (interest) rate at which the net present value of the cost of the investment (negative cash flows) equals the net present value of the benefits of the investment (positive cash flows/fair value).
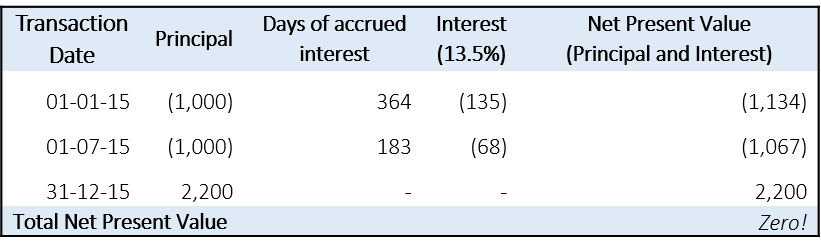
Say I invest $2,000 over two equal tranches, six months apart, which after a year from the initial investment is worth $2,200. In this case, the first $1,000 will accrue interest for one year, the second $1,000 will accrue interest for half a year, and the fair value of $2,200 will not accrue any interest. For the total net cash flows from these three activities to equal zero, the internal discount rate must be 13.5%. This is the IRR.
If we were to change some of these factors; the second tranche occurs two months later than originally contemplated and the fair value is increased by $200, the adjusted IRR is now 32.1%.

This is a particularly simple example. The IRR calculation is robust and can handle numerous cash in- and out-flows over non-linear timing intervals.
 As we can see, the IRR calculation takes two inputs into account:
- The value of multiple cash flows/fair valuation
- Time
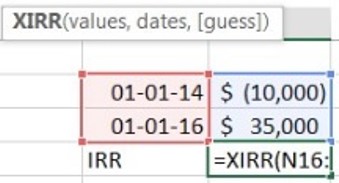
If I invest $10K and two years later it is worth $35K, my IRR is a whopping 87%, a great multiple of 3.5x cash-on-cash. However, let’s say that this investment is dragged out, and only yields the 3.5x after 20 years (!), the diminished IRR of just 6% becomes much less attractive and you may want to look elsewhere to deploy your capital. Such is the case in liquid investments.
Why Venture Capital is different
During their early years, before VC funds show meaningful signs of realized gains, IRR calculations are less relevant for numerous reasons:
- As stated above, cash flows and timing are everything in the IRR calculation. When it comes to open funds, the unrealized fair market valuations (FMV) of the underlying companies are the only input available for analysis. Unfortunately, these values are highly speculative, subject to tremendous volatility and are fraught with risk. The FMV policies of funds will often differ, and as a result, so will their fair market values. As we are dealing with a subjective art as opposed to an objective science, there is little merit in the exercise. Accordingly, every IRR report that is published is covered head to toe with disclaimers.
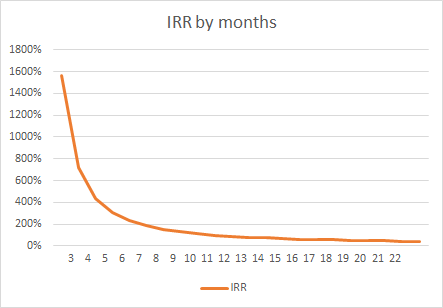
 Timing has a tremendous impact on an IRR, specifically within the first year. Take a look at what happens to the IRR of an investment that doubles cash-over-cash, over a period of time. Note – the graph below starts from the third month only. The IRR was so high during the first 60 days that the graph became a simple right angle, impossible to extract meaning from. One can see how volatile the IRR can be over an exceptionally short period of time in the life cycle of a company.
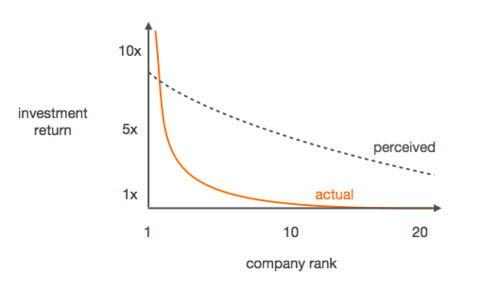
- Calculating the IRR of each deal in your portfolio is even more pointless. Don’t forget the golden rule of VC: the Power Law. Less experienced investors think that the spread of investment returns are linear; you win some and you lose some. However, venture returns are incredible skewed and actual distributions follow the Power Law, with just a handful of companies radically outperforming the others. In fact, the return of the few should offset all the gains and losses of the combined balance of the portfolio.
 Here’s a real example from Andreesen Horowitz: in 2010 the firm invested $250K in Instagram. Just 2 years later, Facebook acquired that company for $1B, and Andreesen Horowitz netted $78M! That’s a 312x return, and almost two thousand percent IRR. However, in a strange way, this wasn’t nearly enough, because Andreesen Horowitz’s fund was $1.5B: assuming they only wrote checks for $250K, they would have had to make this kind of return 19 times just to break even! And so, whilst individual deal economics may look promising, it is the success of the overall portfolio that actually makes an impact on an investor’s wealth position.
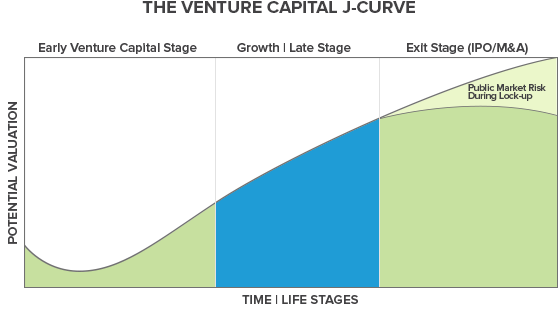
- Fund managers aim to identify the most promising startups that have the potential exit to cover the losses of all the other investments in the portfolio. A swing for the fences; go big or go home kind of attitude. With such high risk in these choices, it is no surprise that sadly, most startups do not IPO or get acquired, but rather shrivel up and die. But for a few precious companies that continue to raise capital and live another day, most companies fold along the way, giving fact to realized losses. As such, the losses of a portfolio become apparent much earlier on in the fund’s life. Immediate down turns before correction and (hopeful) profitability is affectionately referred to as the “J curve”. Even in the absence of losses, another reason for the J Curve’s presence is that a fund manager would typically deduct management fees at the outset of the fund’s activities. This means that the fair value of a fund will continue to fall as management fees are drawn down. During these low times of the J curve lifecycle, it is not uncommon for investors to see negative IRRs, unrealized losses, company write-offs and suffer high blood pressure. As such, these natural teething periods in any funds lifecycle makes looking at the IRR meaningless. The worst case scenario is when an investor panics, acts irrationally, and tries to sell his or her position in the fund on a secondary market (which inevitable will be at some discount to the expected return). A disciplined investor would stay put and ride out the wave.
- As explained above, the IRR equation takes current fair value as an end point. Some companies, however, successfully raise enough cash such that they don’t need to raise additional capital (and therefore revalue themselves) for exceedingly long periods of time. In such a case where the investment remains at cost, the IRR will remain at zero, despite tremendous company growth and development. This could give the misleading impression that a great company is simply mediocre. Contemplate Magic Leap, a US based VR company that recently raised approximately $800 million from a first tier consortium, led by Alibaba. Presumably, this mega-round will give the company enough growth capital to last some time and the company will not revalue itself during this period.
- As positions in funds are generally illiquid with little room to get out, the whole notion of an IRR as a way of being able to compare different investment opportunities seems moot. Usually, if one investment is not performing, an investor would sell that position and put his or her money to work elsewhere. When it comes to venture capital, this option is not readily available, and there is little recourse one can take.
OK, So why do funds publish their IRRs?
Once a fund is in its mature life cycle stage, and has some realized returns under its belt, the IRR becomes meaningful. But until that stage, the jury is still out. When VCs are looking to raise subsequent funds, previous funds’ realized IRRs become the indicator of the fund manager’s ability to pick winning companies. This is a way for VC’s to market their own ability and at the same time highlight the fact that their returns are (hopefully) exceeding those of public markets.
So How Can I Track My Investments?
The best way to track your portfolio’s success is by looking at the bigger picture of how the underlying companies are operating. Some of the typical metrics taught in accounting or business schools simply aren’t appropriate when it comes to assessing the health of a fledgling startup.
Whilst I don’t intend to present an exhaustive list of factors to consider, I do intend to hopefully move the conversation in a different direction; away from “what’s the IRR?”
Here are some of the issues that could be developed into deeper discussion points to give you a better understanding of a company’s performance:
- Has the company attracted additional institutional and strategic investment?
- Has the company successfully on-boarded an exceptional C-suite?
- Does the company’s product/market fit still seem compelling?
- Have other companies in the space been acquired?
- Is the company’s IP portfolio robust?
- Is the company hitting its milestones and executing on its business plan?
I hope the answers to the above points are overwhelmingly positive for at least one of your portfolio companies. If so, you may be backing a winner!